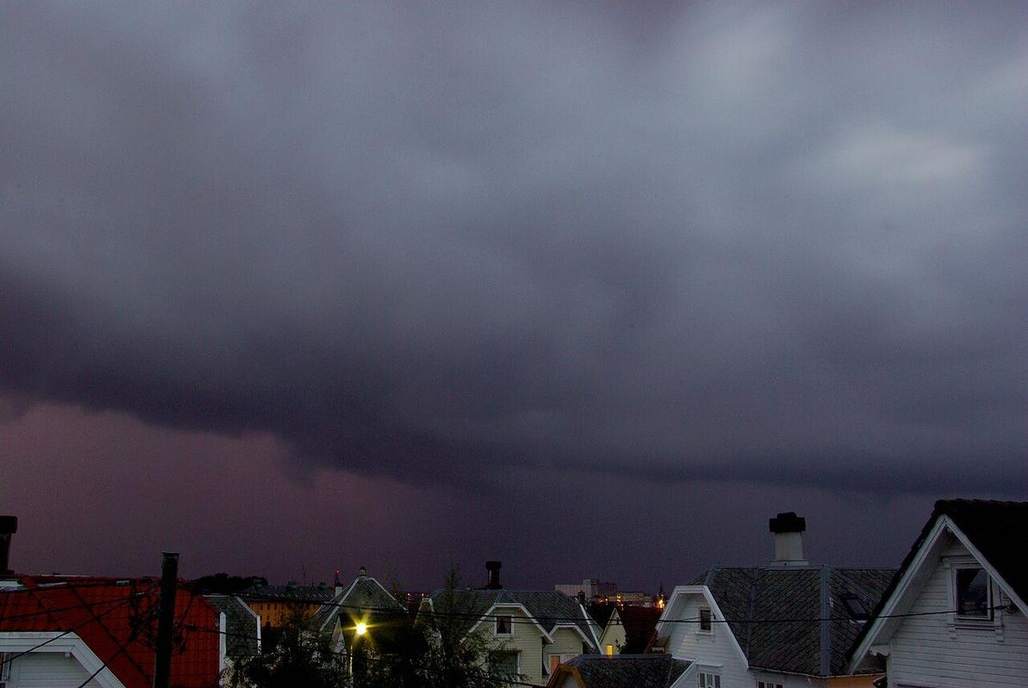
 A wedge, not a painted line.Wikimedia Commons, CC BY-SA
Why this matters
UK midlatitude fronts and a US Midwest squall share the wedge idea, not the violence. A Met Office chart approaching London is a set of surface traces; the weather is on the slope above them. GCSE wants cold, warm, and occluded named and drawn. NGSS wants a boundary with height, not a felt-tip line. If pupils think a front is painted on the television, they will never put cloud ahead of a warm front or a narrow shower on a cold wedge, and they will call every UK rainband a hurricane. Build the wedge. Sit the rain on the slope. Then contrast a quiet UK warm front with a Midwest squall so the class keeps the geometry and drops the cinema.
 Field photograph or official scientific figure for teaching fronts. A second photograph for the projector script — not the lab cover. Source: Wikimedia Commons / NASA / USGS / NOAA, public domain or CC.Wikimedia Commons / NASA / USGS / NOAA, public domain or CC
The mechanism
A front is a sloping boundary between air masses. The map line is where that wedge meets the ground: the surface trace. Dense cold air undercuts; the cold-front wedge is steep, so ascent is sharp and rain is often narrow and showery. Warm air overruns; the warm-front slope is gentler, so cloud thickens ahead and rain can be longer and lighter. Between them sits the warm sector. Occlusion is the cold front catching the warm front so the warm air is lifted off the surface: the comma tail of a mature midlatitude cyclone, not a tropical eyewall. A UK winter depression approaching London is this machine. A US Midwest squall can be a violent cold-front cousin; Sandy is a hybrid caution, not a reason to brand every UK rainband a hurricane. Do not teach fronts only as symbols on a key. Do not draw a vertical wall. Clouds sit on the slope because that is where the air is lifted. Play the system so occlusion is a catch, not a vocabulary word. A sea-breeze front is a tiny cousin of the same idea, kilometres not a depression.
How to drive the model
Space plays the midlatitude system so the cold wedge can catch the warm. Arrow keys freeze the occlusion for the board. L hides labels; ask where the rain sits before you reveal the slope. R resets the wedges. P is projector. Time is a process clock, not a year; the drive is Space to play, arrows to scrub, and a pause on the comma tail. Share the URL when the rainband sits on the cold slope, then again at occlusion, so the catch is a link the class can reopen after the bell.
If the model will not spin
If JavaScript or WebGL dies, the 2D fallback still shows a wedge and a map line. Teach from the steps: cold undercuts, warm overruns, occlusion when the cold catches the warm. Check still names the steep wedge, the gentle slope, the catch, and the surface trace. Print the teacher script. The glossary still carries warm sector, surface trace, and squall line. You lose the 3D rainband, not the reason a Met Office line is not a wall. A paper cross-section of two wedges can stand in for the canvas; sit the cloud on the slope, not on the ink.
Film
What Are the Different Types of Cyclones? Crash Course Geography #12. Crash Course Geography. About 11 min. Crash Course / Complexly on YouTube. Standard YouTube licence. Educational embed, autoplay off. Autoplay off.
Misconceptions
A front is a painted line.
The line is where the wedge meets the ground. The weather is on the slope.
A cold front is a vertical wall of cold.
It is a steep wedge. Dense air undercuts. Rain sits on the slope, often narrow and showery.
Every UK rainband is a hurricane.
A midlatitude front is a different machine from a tropical eyewall. Share the wedge idea, not the violence.
Cold front
Leading edge of colder air. Steeper wedge. Rain often narrow and showery.
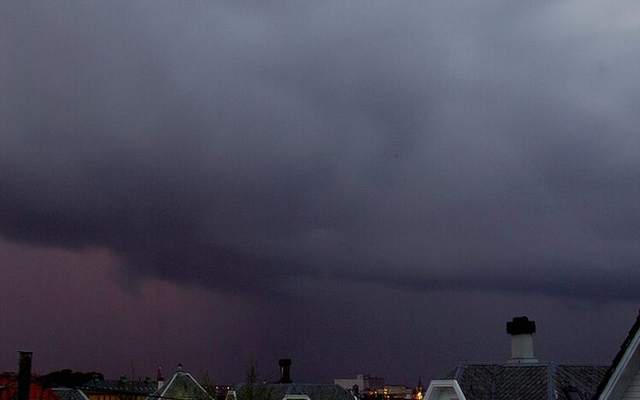 Cold front in the fronts lab — a TERMS crop, not the glossary plate and not the lab cover. Leading edge of colder air. Source: Wikimedia Commons / NASA / USGS / public domain.Wikimedia Commons / NASA / USGS / public domain
Warm front
Leading edge of warmer air. Gentler slope. Cloud thickening ahead.
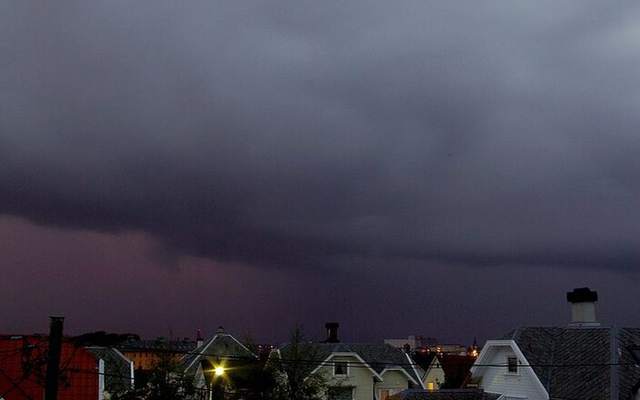 warm front in the fronts lab — a TERMS crop, not the glossary plate and not the lab cover. A TERMS crop, not the glossary plate and not the lab cover. Source: Wikimedia Commons / NASA / USGS / NOAA, public domain or CC.Wikimedia Commons / NASA / USGS / NOAA, public domain or CC
Occlusion
Cold front catching a warm front; warm air lifted off the surface.
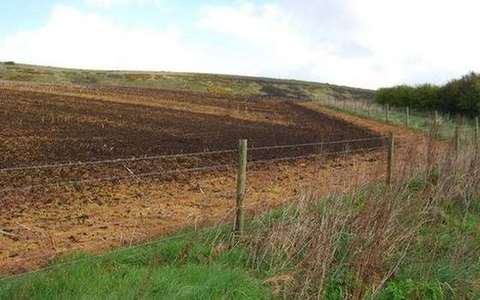 occlusion in the fronts lab — a TERMS crop, not the glossary plate and not the lab cover. A TERMS crop, not the glossary plate and not the lab cover. Source: Wikimedia Commons / NASA / USGS / NOAA, public domain or CC.Wikimedia Commons / NASA / USGS / NOAA, public domain or CC
Warm sector
The milder air between the warm front and the cold front in a midlatitude cyclone.
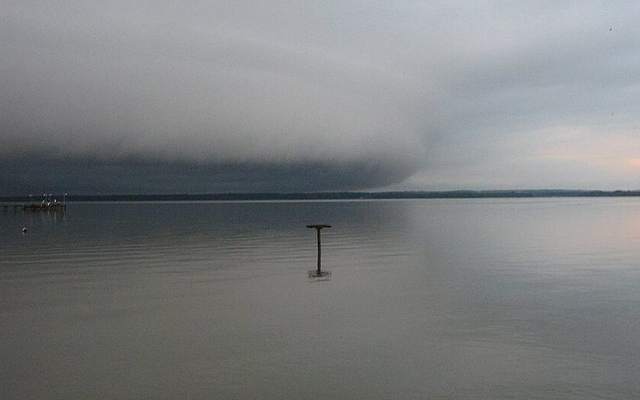 warm sector in the fronts lab — a TERMS crop, not the glossary plate and not the lab cover. A TERMS crop, not the glossary plate and not the lab cover. Source: Wikimedia Commons / NASA / USGS / NOAA, public domain or CC.Wikimedia Commons / NASA / USGS / NOAA, public domain or CC
Surface trace
Where the sloping front meets the ground. The line on the chart.
 surface trace in the fronts lab — a TERMS crop, not the glossary plate and not the lab cover. A TERMS crop, not the glossary plate and not the lab cover. Source: Wikimedia Commons / NASA / USGS / NOAA, public domain or CC.Wikimedia Commons / NASA / USGS / NOAA, public domain or CC
Air mass
A large body of air with fairly even temperature and humidity, sitting on a source region.
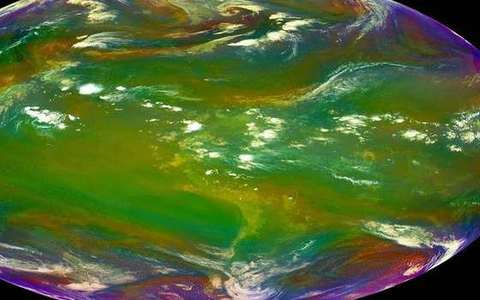 Air mass in the fronts lab — a TERMS crop, not the glossary plate and not the lab cover. A large body of air with fairly even temperature and humidity, sitting on a source region. Source: Wikimedia Commons / NASA / USGS / public domain.Wikimedia Commons / NASA / USGS / public domain
Squall line
A narrow, often violent band of convection, commonly along or ahead of a cold front.
 squall line in the fronts lab — a TERMS crop, not the glossary plate and not the lab cover. A TERMS crop, not the glossary plate and not the lab cover. Source: Wikimedia Commons / NASA / USGS / NOAA, public domain or CC.Wikimedia Commons / NASA / USGS / NOAA, public domain or CC