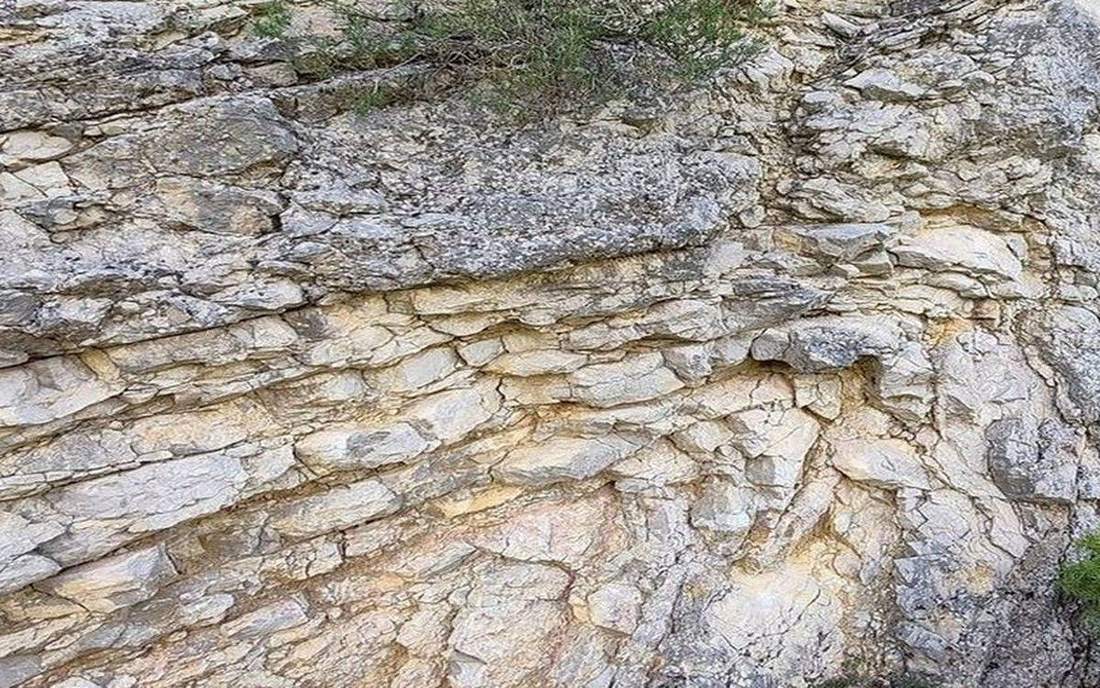
 A hydrograph: rain then discharge against time. A hydrograph plots rainfall then river discharge against time. Source: Wikimedia Commons / NASA / USGS / NOAA, public domain or CC.Wikimedia Commons / NASA / USGS / NOAA, public domain or CC
Why this matters
Somerset Levels can sit on a falling limb for weeks after the rain has stopped. A paved UK high street and a US urban drain flash in hours. Same storm-hydrograph machine, different numbers. Lag time is why a village floods after the radar looks quiet, and why a city gully roars while the cloud is still overhead. Land use is a control, not a personality: impermeable roofs shorten lag and raise the peak; vegetated soil lengthens lag and fattens the falling limb. Environment Agency flood warnings and USGS stream gauges both plot this graph. The Levels are peat, clay and tide-lock; Katrina-Sandy urban flooding is a different surface on the same axes. Do not mix the two as one story. The graph is the reply of a catchment to a pulse of rain.
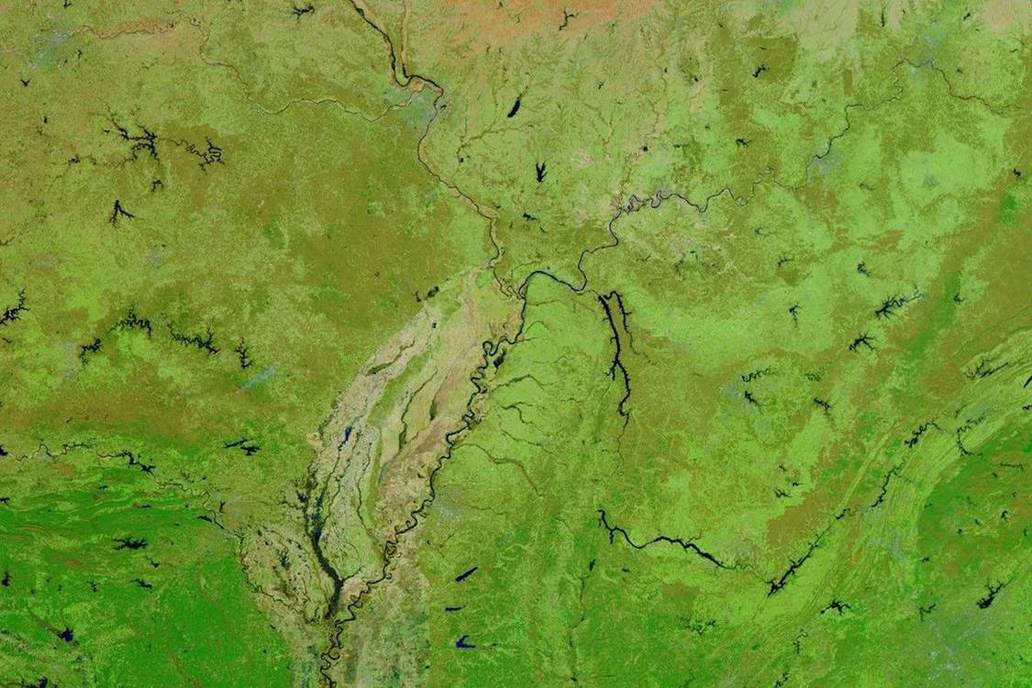 A second photograph for the projector script — not the lab cover.Wikimedia Commons / NASA / USGS
The mechanism
A storm hydrograph plots discharge against time after rainfall. Rain is the input. The river’s reply has four named parts: a rising limb as the catchment starts to contribute, a peak, a lag from rainfall peak to discharge peak, and a falling limb as the hill empties. The river does not peak when the rain peaks. The hillside, soil and channel have to drain. Urban cover raises the fraction of impermeable surface: water cannot wait in the soil, so lag shortens and the peak rises — a flashier graph. Rural cover does the opposite: fatter, later. Baseflow is the slow groundwater contribution under the storm pulse. Stage is height of the water surface; discharge is volume per time. Do not mix them. A high stage in a narrow urban drain is not the same discharge as that height on the Parrett. Somerset’s almost-flat long profile and saturated peat stretch the falling limb. A flashy urban drain does not. Throughflow and overland flow are the hill’s pipes; impermeable cover skips the slow ones. This lab holds storm size still so land use is the knob you turn. This lab is hours, not the year — that is the regime lab.
How to drive the model
Play the storm (space). Watch rain fall, then the river’s reply on the graph: rising limb, peak, lag, falling limb. Raise Urban cover toward 1 and run it again: shorter lag, higher peak, roofs instead of trees. Drop Urban cover toward rural and compare. Freeze on the peak and read the lag tag in hours. There is no labelled time slider — space still plays the pulse, arrows still scrub it. Name the four parts out loud before you leave the graph. Keyboard: space play, arrows scrub the storm, L labels, R reset. Urban cover lives in the bar. Finish in Check.
If the model will not spin
Without the 3D view: rain is the input; the river replies after a lag. Rising limb, peak, falling limb. Urban surfaces shorten lag and raise the peak. Rural catchments are fatter and later. Stage is height; discharge is volume per time. Somerset can sit on a falling limb for weeks. A hydrograph is hours. A regime graph is the year. Impermeable roofs skip the soil store. Baseflow sits under the pulse. The hill is a schematic catchment, not a traced Parrett.
Film
How Water Shapes the Land: Crash Course Geology #9. Crash Course Geology. About 10 min. Crash Course Geology / Complexly on YouTube. Standard YouTube licence. Educational embed, autoplay off. Autoplay off.
Misconceptions
The river peaks when the rain peaks.
Lag. The hill has to drain.
Stage and discharge are the same thing.
Stage is height. Discharge is volume per time. A narrow drain and a wide floodplain disagree.
Urban land use stops flooding by putting water in pipes.
Pipes and roofs shorten lag and raise the peak. The water still has to go somewhere.
Hydrograph
Discharge plotted against time after rain. A storm hydrograph is hours; a regime graph is the year.
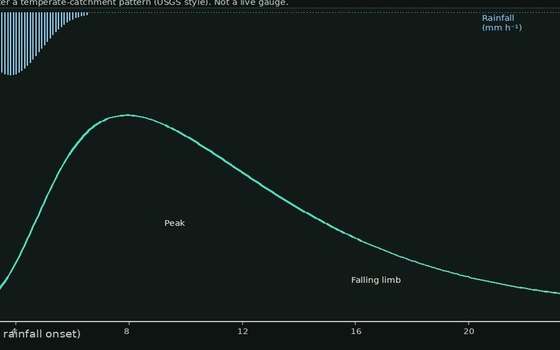 Hydrograph in the hydrograph lab — a TERMS crop, not the glossary plate and not the lab cover. Discharge plotted against time after rain. Source: Wikimedia Commons / NASA / USGS / public domain.Wikimedia Commons / NASA / USGS / public domain
Lag time
Time from peak rainfall to peak discharge. The hill has to drain.
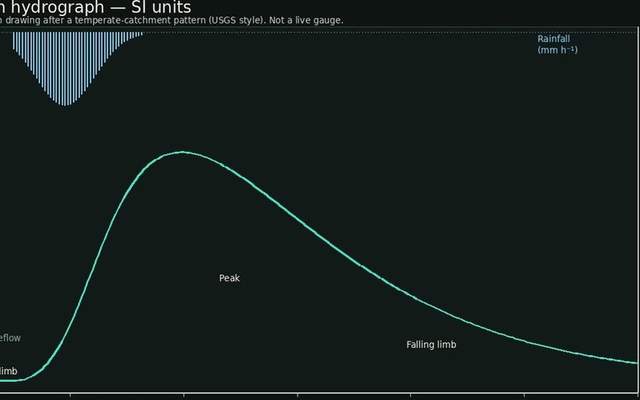 lag time in the hydrograph lab — a TERMS crop, not the glossary plate and not the lab cover. A TERMS crop, not the glossary plate and not the lab cover. Source: Wikimedia Commons / NASA / USGS / NOAA, public domain or CC.Wikimedia Commons / NASA / USGS / NOAA, public domain or CC
Rising limb
The increase in discharge as the catchment starts to contribute.
 rising limb in the hydrograph lab — a TERMS crop, not the glossary plate and not the lab cover. A TERMS crop, not the glossary plate and not the lab cover. Source: Wikimedia Commons / NASA / USGS / NOAA, public domain or CC.Wikimedia Commons / NASA / USGS / NOAA, public domain or CC
Peak discharge
The highest discharge in the storm reply.
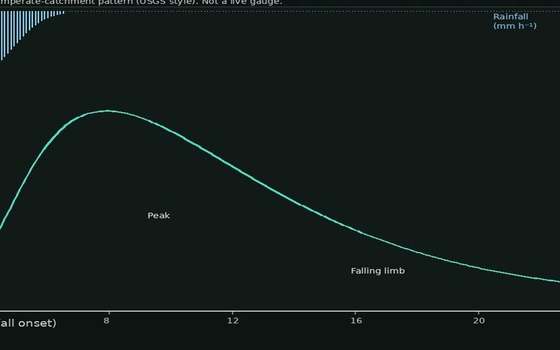 peak discharge in the hydrograph lab — a TERMS crop, not the glossary plate and not the lab cover. A TERMS crop, not the glossary plate and not the lab cover. Source: Wikimedia Commons / NASA / USGS / NOAA, public domain or CC.Wikimedia Commons / NASA / USGS / NOAA, public domain or CC
Falling limb
Discharge declining after the peak as the catchment empties.
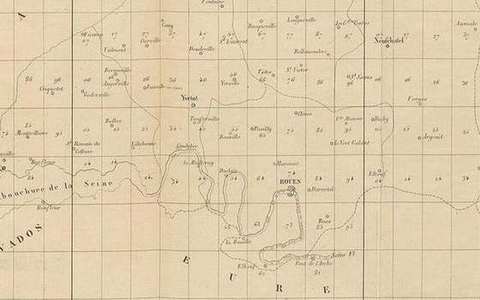 falling limb in the hydrograph lab — a TERMS crop, not the glossary plate and not the lab cover. A TERMS crop, not the glossary plate and not the lab cover. Source: Wikimedia Commons / NASA / USGS / NOAA, public domain or CC.Wikimedia Commons / NASA / USGS / NOAA, public domain or CC
Baseflow
Slow groundwater contribution under the storm pulse.
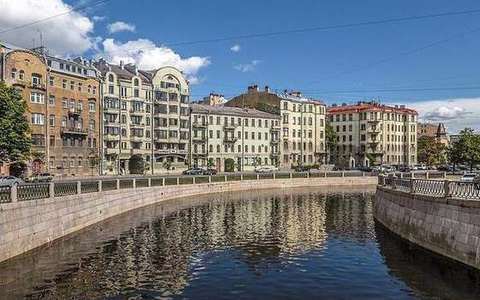 baseflow in the hydrograph lab — a TERMS crop, not the glossary plate and not the lab cover. A TERMS crop, not the glossary plate and not the lab cover. Source: Wikimedia Commons / NASA / USGS / NOAA, public domain or CC.Wikimedia Commons / NASA / USGS / NOAA, public domain or CC
Stage
Height of the water surface. Not the same as discharge.
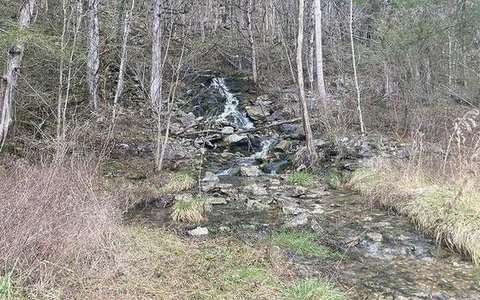 stage in the hydrograph lab — a TERMS crop, not the glossary plate and not the lab cover. A TERMS crop, not the glossary plate and not the lab cover. Source: Wikimedia Commons / NASA / USGS / NOAA, public domain or CC.Wikimedia Commons / NASA / USGS / NOAA, public domain or CC
Discharge
Volume of water per time passing a point. Cubic metres per second in school units.
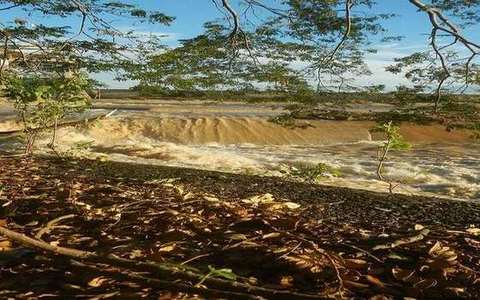 Discharge in the hydrograph lab — a TERMS crop, not the glossary plate and not the lab cover. Volume of water per time passing a point. Source: Wikimedia Commons / NASA / USGS / public domain.Wikimedia Commons / NASA / USGS / public domain